
AI automation · Manufacturers
AI automation for manufacturers: protect capacity, quality and delivery
For a manufacturer, AI creates value when it protects production capacity, maintains quality and delivers profitable orders on time. It can connect what accounting knows about cost with what production knows about constraints and what sales knows about demand. Companies that wait keep paying for avoidable downtime, excess stock and slow administrative work. ECOM’s AI automation specialists help you start with a defined operational problem and usable data, then prove the result.
Who it serves
Who in manufacturers this helps
Plant and operations managers
See congestion and infeasible promises before they reach a constrained work center.
Maintenance and quality engineers
Turn a warning into a completed response with an owner, a window and a spare part.
Purchasing, planning and sales
Spot supplier delay risk and quote dates that respect material and capacity limits.
Finance and IT
Match documents automatically and keep the connected records AI depends on.
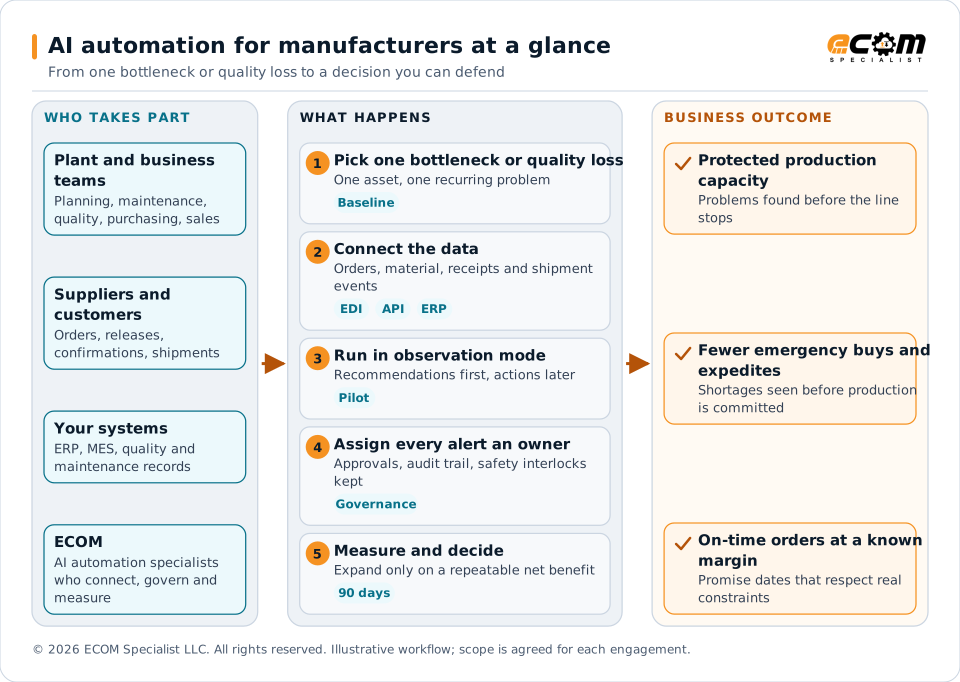
The drawing follows a manufacturer from one bottleneck or quality loss, through connecting orders, material and shipment data, running in observation mode, giving every alert an owner and measuring the result over 90 days. The outcomes are protected capacity, fewer emergency buys and on-time orders at a known margin. They are goals to measure against your own baseline, not guaranteed results.
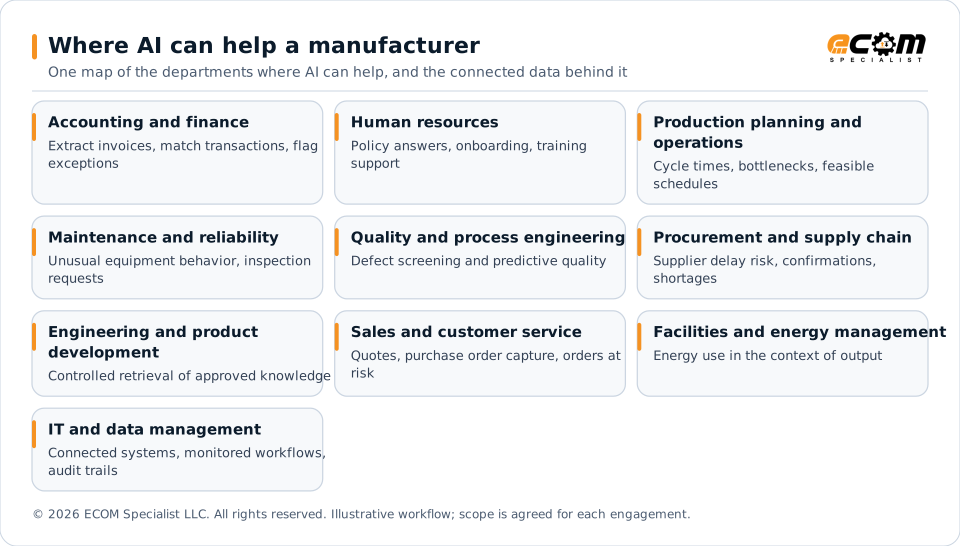
The map lists 10 departments and, for each, the kind of work AI can support: accounting and finance (extract invoices, match transactions, flag exceptions); human resources (policy answers, onboarding, training support); production planning and operations (cycle times, bottlenecks, feasible schedules); maintenance and reliability (unusual equipment behavior, inspection requests); quality and process engineering (defect screening and predictive quality); procurement and supply chain (supplier delay risk, confirmations, shortages); engineering and product development (controlled retrieval of approved knowledge); sales and customer service (quotes, purchase order capture, orders at risk); facilities and energy management (energy use in the context of output); it and data management (connected systems, monitored workflows, audit trails). These are practical opportunities, not claims that every company has implemented them.
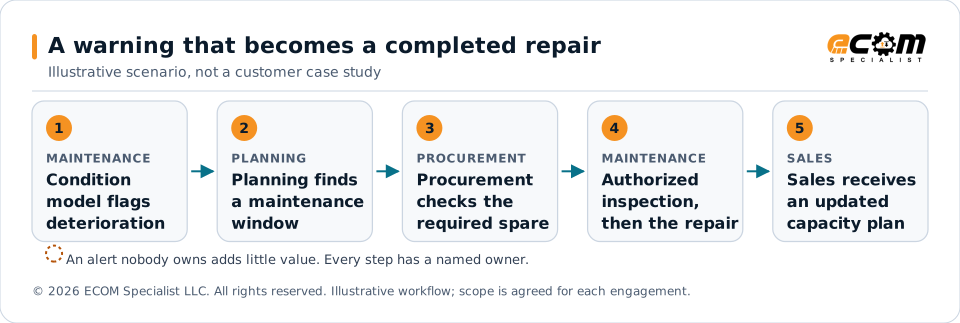
A condition model flags deterioration on a critical packaging machine. Planning identifies an available maintenance window and procurement checks the required spare. After an authorized inspection, maintenance completes the repair, and sales receives an updated capacity plan. The value is in the completed response, not in the warning alone.
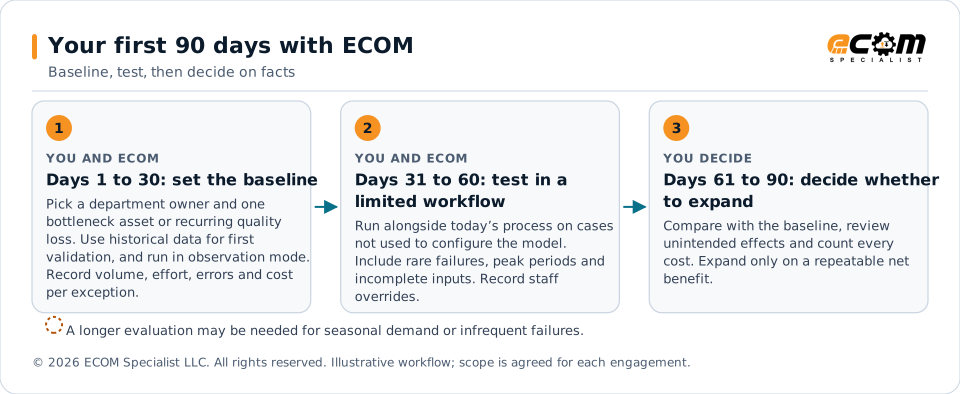
Days 1 to 30 set a baseline: a department owner, one recurring problem, current volume, effort, errors and cost per exception, confirmed data access and a definition of success. Days 31 to 60 test in a limited workflow, alongside the current process, on cases not used to configure the model, with staff overrides recorded. Days 61 to 90 compare the results with the baseline, count every cost and expand only if a repeatable net benefit is shown.
The cost of waiting
What companies miss by waiting
Downtime you could have seen coming
Breakdown repairs and fixed-schedule parts replacement miss the chance to repair a critical asset during a planned stop.
Defects found after a big batch
An unstable process runs on before quality staff notice, costing material, time and customer confidence.
Schedules built on averages
Congestion hides in the average, and overtime and premium freight follow when an order reaches a constrained work center.
Shortages after production is committed
Emergency buys rise while excess stock builds up in materials you no longer need.
Alerts nobody owns
A model that raises warnings with no owner and no response workflow adds little operational value.
Department by department
Where AI helps, what waiting costs and how ECOM helps
The department list below comes from practical opportunities, not claims that every plant has the data or economics to repeat them. Start with one row.
| Department | Where AI can help | What waiting costs | How ECOM helps, and what to measure |
|---|---|---|---|
| Accounting and finance | Extract invoice and remittance details, suggest account coding, match transactions, prioritize exceptions and flag unusual payments. | Staff rekey documents and chase routine discrepancies. Cash and margin problems show up only after the reporting cycle closes. | Connects invoices, receipts, purchase orders and remittances from EDI, APIs and documents into one matched flow with exception queues. The controller keeps approval of payments, write-offs and material adjustments. Measure: cost per transaction, exception rate, days to close, overdue receivables. |
| Human resources | Answer questions from approved policies, guide onboarding, suggest role-specific training and forecast staffing demand. | Experienced employees repeat the same procedures, new hires take longer to become productive and staffing reacts only after overtime has risen. | Starts with policy search and training support built on approved content. Hiring, pay and disciplinary decisions stay under accountable human review. Measure: onboarding time, policy response time, training completion, overtime. |
| Production planning and operations | Estimate cycle times, bottlenecks and order completion risk from machine history, material availability and work in process. Compare feasible schedules under labor, tooling and changeover constraints. | Schedules rely on averages that hide congestion. Planners learn a promise is infeasible only when the order reaches a constrained work center, creating overtime and premium freight. | Connects orders, releases, material confirmations and shipment events to the planning workflow. Supervisors approve changes before they affect customer commitments. Measure: schedule adherence, throughput, changeover time, on-time delivery. |
| Maintenance and reliability | Combine vibration, temperature, current draw and maintenance history to identify unusual equipment behavior, then raise an inspection request and recommend a maintenance window. | The plant relies on breakdown repairs or replaces parts on a fixed schedule despite their condition, and misses the chance to fix a critical asset during a planned stop. | Builds the response workflow around the warning: an owner, the inspection request, the spare-part check and the planned window. Begin with one critical asset and keep safety interlocks and manufacturer requirements in place. Measure: unplanned downtime, maintenance cost, warning lead time, false alarm rate. |
| Quality and process engineering | Screen parts for visible defects with vision models, and examine process settings, material lots and inspection results to prioritize root-cause work. AI does not establish causation just because two variables move together. | An unstable process produces a larger batch before quality staff see the problem. The plant loses material, production time and customer confidence when defects escape. | Links inspection results to lot, order and shipment records so engineers can test controlled adjustments. Validate missed defects and false rejects separately, across variants and operating conditions. Measure: first pass yield, scrap, rework, customer defects. |
| Procurement and supply chain | Estimate supplier delay risk and material shortages, and compare confirmations and invoices with purchase orders so buyers can investigate substitutions or transfers earlier. | Shortages surface after production is committed. Purchasing pays for emergency buys while excess stock builds up in materials no longer needed. | Connects bills of material, lead times, approved suppliers and actual receipts through EDI and APIs. Engineers keep control of approved material changes. Measure: supplier reliability, shortage-related downtime, inventory days, expedite cost. |
| Engineering and product development | Search approved engineering knowledge, summarize change requests and help draft work instructions. Controlled retrieval of the correct drawing revision is often worth more than a persuasive free-form answer. | Teams repeat earlier investigations and spend time locating specifications. Expertise stays with a few people, which raises the impact of retirements and turnover. | Helps you scope retrieval over approved documents with access controls that protect intellectual property. Engineers verify designs, tolerances and safety-related instructions. Measure: engineering change cycle time, document search time, instruction-related errors. |
| Sales and customer service | Prepare quotations from approved product and pricing data, extract purchase orders and identify orders at risk of delay. Highlight customers or products whose service cost is eroding profit. | Quotes take longer and sales promise dates that ignore material or capacity limits. Customer service gathers updates instead of resolving delivery risks. | Captures orders from EDI, APIs and documents and connects customer requirements, capacity, inventory and pricing approvals so a promise date rests on current constraints. Measure: quote turnaround, order entry accuracy, promise accuracy, contribution margin. |
| Facilities and energy management | Compare energy consumption with output, machine states and operating schedules to detect unusual loads, and suggest when flexible equipment can run without breaking production, quality or safety constraints. | An energy dashboard shows a larger bill without saying whether waste, higher output or a different product mix caused it, so reductions per good unit go unfound. | Connects production context to energy data so changes are reviewed jointly by facilities and production. Measure: kilowatt hours per good unit, peak demand, verified savings adjusted for output. |
| IT and data management | Summarize incidents, help diagnose integration failures and identify unusual system behavior. | Departments keep conflicting spreadsheets and AI works from stale records, so one wrong inventory balance or customer identity spreads errors across the business. | Connects operational systems through managed EDI and API integrations with monitoring, a named owner, an audit trail and a way to reverse each action. Measure: data freshness, integration failures, duplicate records, recovery time. |
Capabilities
How ECOM’s AI automation specialists help manufacturers
Open any item for the detail.
Start with a defined operational problemOne bottleneck asset or one recurring quality loss.
- Choose a department owner and one recurring problem. For many plants that is a single bottleneck asset or a recurring quality loss, plus invoice or order extraction if document volume supports it.
- Use historical data for initial validation and run recommendations in observation mode before allowing any operational action.
- Record current volume, labor effort, errors, service outcomes and the cost of each exception before you select a tool.
Connect the data your AI needsOrders, confirmations, shipments and invoices from the systems that already hold them.
- EDI and APIs can supply orders, order confirmations, shipment events and invoices from your trading partners and your ERP, warehouse and transportation systems.
- ECOM connects those feeds with shared identifiers, timestamps and validation rules, so every record stays traceable from the source to the decision.
- A fast recommendation built on a stale inventory balance or a duplicate customer record spreads errors. Clean, connected data comes first.
Automate the document-heavy stepsPDFs, emails and images become validated data in the same workflow.
- Document extraction brings information from PDFs, emails and images into the same workflow as your EDI and API data.
- Validation rules check the extracted data against the order, the shipment or the contract, and incomplete or unusual items go to an exception queue with an owner.
- Where a stable rule solves a clear requirement, ECOM recommends the rule. Not every workflow needs AI.
Keep people in controlApprovals, audit trails and a manual fallback.
- Connecting a model to a system does not by itself authorize it to change a financial or operational record. ECOM helps you define what each automated step may do, who approves it and how to reverse it.
- Every important action has an owner, an audit trail and a manual fallback. Staff can inspect and override a recommendation.
- The voluntary NIST AI Risk Management Framework gives a practical structure for approved uses, responsible owners, escalation thresholds and monitoring.
Prove it, then decide whether to expandA baseline, a limited pilot and a net-benefit decision.
- ECOM helps you record today’s volume, effort, errors and exception cost, run the new workflow alongside the current one and compare the results with a simple baseline.
- The business case includes software, integration, training, review time and monitoring, not only the savings. You expand only when a repeatable net benefit is shown.
- Seasonal demand or infrequent failures may need a longer evaluation. ECOM plans for that up front.
In practice
Manufacturing example: a warning that becomes a completed repair
A packaging machine shows signs of wearIllustrative scenario, not a customer case study.
- A condition model flags deterioration on a critical packaging machine. Planning identifies an available maintenance window and procurement checks the required spare.
- After an authorized inspection, maintenance completes the repair and sales receives an updated capacity plan.
- The value comes from the completed response, not the warning alone. A model that generates alerts nobody owns adds little operational value.
What is it worth? A calculation you can reuseIllustrative arithmetic, not a promise.
- Illustrative calculation only. If a team handles 5,000 documents a month and reduces average handling time from 8 minutes to 3 minutes, it releases about 417 staff hours monthly. At an assumed loaded labor cost of $35 per hour, that is about $14,600 in monthly capacity value.
- That value becomes cash savings only if spending actually falls. Otherwise the benefit comes from useful redeployment, greater throughput or better service.
- Net annual benefit equals verified annual operating gains minus annual software, support, monitoring and other recurring costs. Simple payback equals the one-time implementation cost divided by the positive monthly net benefit.
- Keep released working capital separate from recurring profit, and avoid counting the same labor or error reduction twice. Bring your own volumes and ECOM will work through the arithmetic with you.
Business benefits
What this means for the business
Capacity you can count on
Fewer unplanned stops and earlier, planned repairs.
Less scrap and rework
Process drift and defects are examined sooner, with engineers in control of adjustments.
Fewer emergency purchases
Supplier delays and shortages are seen before production is committed.
Orders promised on facts
Quote and promise dates reflect real material and capacity constraints.
What public sources show
This is the source’s own description. It is not an ECOM project and not a forecast for your plant.
- NIST’s Manufacturing Extension Partnership describes manufacturing AI applications involving forecasting, anomalies, equipment uptime, quality and scrap reduction. Its practical lesson is to start with a defined operational problem and usable data. The existence of successful applications does not mean every plant has the data or economics to reproduce them.
- The NIST AI Risk Management Framework is a voluntary structure for governing, mapping, measuring and managing AI risk. It is a practical reference for approved uses, responsible owners, escalation thresholds and monitoring.
- U.S. EEOC guidance explains that employment discrimination protections also apply when AI is involved. Obtain HR and legal review for any tool that affects hiring, pay or discipline.
How to evaluate manufacturing AI
Pick the measures for the row you start with, record a baseline and keep the definitions fixed.
- Schedule adherence, throughput and on-time delivery
- Unplanned downtime, warning lead time and false alarm rate
- First pass yield, scrap, rework and customer defects
- Supplier reliability, shortage-related downtime and expedite cost
- Quote turnaround, order entry accuracy and promise accuracy
- Kilowatt hours per good unit, adjusted for output
Getting started
Bring your costliest recurring plant problem
Tell ECOM which recurring problem costs you the most: one bottleneck asset, a recurring quality loss, late supplier material or hours of purchase order and invoice keying. Bring a rough monthly volume and the systems involved. ECOM’s AI automation specialists will help you define a baseline, the data you need and a limited first workflow, so you can decide on facts whether to expand. You do not need a model, a vendor or a budget line before the first conversation.
Frequently asked questions
How can AI help a U.S. manufacturer?
AI can estimate order completion risk, flag unusual equipment behavior, screen for defects, predict supplier delays, extract purchase orders and compare energy use with output. Each works only where the plant has usable data and the economics support it, so ECOM starts with one defined problem.
Where should a manufacturer start with AI?
With one bottleneck asset or one recurring quality loss, run in observation mode on historical data first. Add invoice or order extraction if document volume justifies it.
What does ECOM do for a manufacturer’s AI project?
ECOM’s AI automation specialists help you choose the first workflow, connect order, material and shipment data from your partners and systems, build the response workflow around each warning, set approvals and audit trails, and measure the result. Specialist models may come from your own systems or other providers.
Does predictive maintenance work for every machine?
No. It is most useful where failures have detectable precursors and enough evidence exists to validate them. Start with one critical asset and keep safety interlocks and manufacturer maintenance requirements.
How do EDI and APIs connect to AI in a plant?
EDI and APIs supply customer orders and releases, supplier confirmations, shipment events and invoices. With shared identifiers and validation rules, planning, purchasing and sales work from the same current records.
What does waiting cost a manufacturer?
Avoidable downtime, excess stock, premium freight, slow quoting and manual document work. ECOM helps you put your own volumes into a net-benefit calculation rather than guess.
AI Automation by Industry
Other industries
-
Retailers
Demand, invoices, supplier delays, store tasks and fulfillment: AI on connected data, proven in 90 days.
View retailers -
Logistics and carriers
Arrival prediction, warehouse labor, fleet maintenance, billing and claims: AI on connected shipment data.
View logistics and carriers -
Automotive businesses
Quality and traceability, supplier releases, parts distribution, dealer leads and service readiness.
View automotive businesses
Talk to an AI Automation Specialist about AI for manufacturers
Tell us the recurring problem that costs you most and the systems involved. We will outline a baseline, the data you need and a limited first workflow you can judge on facts.